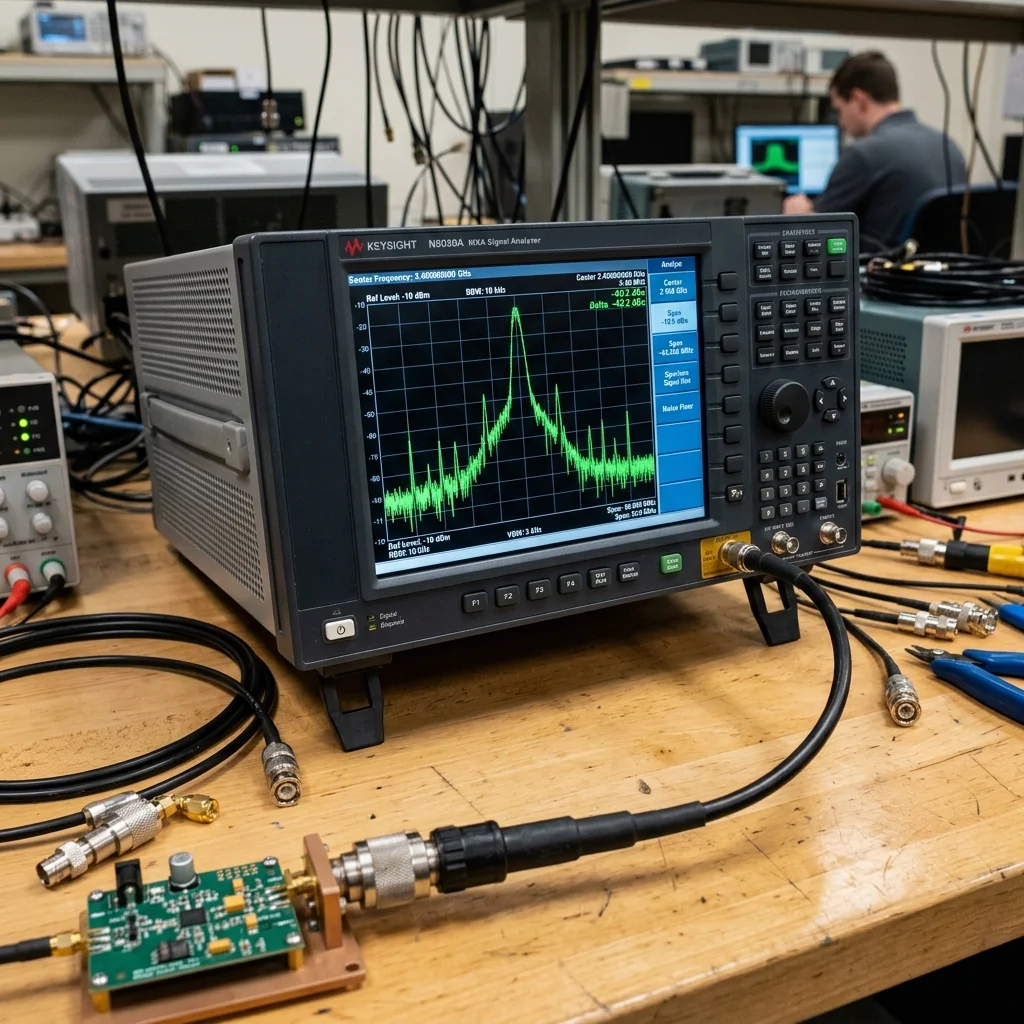
A spectrum analyzer's dynamic range defines the usable measurement window between the smallest signal it can detect and the largest signal it can handle without generating false responses. This window is bounded on the bottom by the Displayed Average Noise Level (DANL) and on the top by compression, intermodulation distortion, or phase noise, depending on the measurement scenario. Understanding which limit applies in your specific measurement is the difference between trusting your data and publishing artifacts.
DANL: The Noise Floor
The DANL is the average noise power displayed on the screen when no signal is applied. It is determined by the thermal noise of the input attenuator, the noise figure of the first mixer and IF chain, the resolution bandwidth (RBW) setting, and the display detector mode.
DANL scales directly with RBW: reducing the RBW by a factor of 10 reduces the DANL by 10 dB. A modern high-performance spectrum analyzer achieves DANL of -165 dBm/Hz (normalized to 1 Hz bandwidth) at frequencies below 3 GHz. At 40 GHz, the DANL degrades to approximately -145 dBm/Hz due to higher mixer noise figure.
| Spec | Entry-Level SA | Mid-Range SA | High-Performance SA | Real-Time SA |
|---|---|---|---|---|
| DANL (1 Hz, <3 GHz) | -145 dBm | -155 dBm | -165 dBm | -160 dBm |
| DANL (1 Hz, 26 GHz) | -130 dBm | -140 dBm | -150 dBm | -145 dBm |
| TOI (+10 dBm mixer) | +10 dBm | +15 dBm | +22 dBm | +18 dBm |
| Phase noise (10 kHz) | -90 dBc/Hz | -105 dBc/Hz | -120 dBc/Hz | -110 dBc/Hz |
| Max spurious-free DR | 70 dB | 85 dB | 100+ dB | 90 dB |
Third-Order Intercept: The Distortion Ceiling
When measuring two or more signals simultaneously, the mixer's nonlinearity generates intermodulation products. The most troublesome are the third-order products at frequencies 2f₁ - f₂ and 2f₂ - f₁, which fall close to the original signals and cannot be filtered. The third-order intercept point (TOI or IP3) is the theoretical power level where the intermodulation products would equal the fundamental signals.
The spurious-free dynamic range (SFDR) for two-tone measurements is: SFDR = 2/3 × (TOI - DANL). For a spectrum analyzer with TOI = +15 dBm and DANL = -155 dBm/Hz (at 1 kHz RBW, DANL = -125 dBm), the SFDR = 2/3 × (15 + 125) = 93 dB. This means the analyzer can measure two signals within a 93 dB amplitude range without generating visible intermodulation products.
Optimizing Dynamic Range: The maximum dynamic range occurs at a specific input attenuator setting that balances the noise floor (which rises with attenuation) against distortion (which decreases with attenuation). This optimal setting is typically 5 to 10 dB of input attenuation. More attenuation raises the noise floor. Less attenuation increases distortion. Most modern analyzers have an "auto-range" function that seeks this optimum, but manual optimization is often required for demanding measurements.
Phase Noise: The Close-In Limit
When measuring a signal's spectral purity at small frequency offsets (1 kHz to 1 MHz from the carrier), the spectrum analyzer's own local oscillator (LO) phase noise becomes the limiting factor. The displayed signal appears to have "skirts" that are actually the analyzer's LO phase noise convolved with the signal. If the LO phase noise at 10 kHz offset is -105 dBc/Hz, the analyzer cannot measure a signal's phase noise at 10 kHz offset below -105 dBc/Hz.
When Phase Noise Dominates
- Oscillator characterization: measuring the spectral purity of a VCO or crystal oscillator. The analyzer's LO phase noise must be at least 10 dB lower than the device under test.
- Adjacent channel power: in communication systems, phase noise sets the floor for adjacent channel leakage ratio (ACLR) measurements.
- Close-in spurious signals: spurs within 100 kHz of a strong carrier may be obscured by phase noise if the analyzer's LO is not sufficiently clean.
For measurements requiring the lowest possible phase noise, dedicated signal source analyzers (such as the Keysight E5052B) use cross-correlation techniques to reduce the effective LO phase noise by 20 to 30 dB below the hardware specification. Standard spectrum analyzers cannot do this.
Measurement Optimization Techniques
- Set RBW appropriately: narrower RBW reduces the noise floor but increases sweep time quadratically. For two-tone SFDR measurements, use the narrowest RBW that keeps sweep time acceptable.
- Use an external preamplifier for low-level signal measurements. A low-noise external preamp with 2 dB NF improves the effective DANL by the preamp gain minus the preamp noise figure. A 30 dB gain, 2 dB NF preamp improves DANL by approximately 28 dB.
- Use a precision matched load on the input for baseline noise measurements. Any mismatch at the input creates standing waves that modulate the noise floor.
- Average multiple sweeps to reduce noise floor by 10×log₁₀(N) dB, where N is the number of averages. 100 averages reduces the effective noise floor by 20 dB at the cost of 100× measurement time.
- Use external precision attenuators instead of the analyzer's built-in step attenuator for measurements requiring the best match and flatness.
Precision terminations, attenuators, and adapters for spectrum analyzer and VNA measurements. Calibration-grade components for accurate RF test setups.